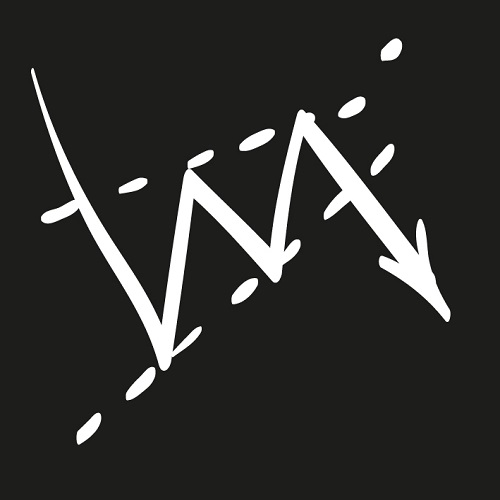
The wedge pattern is a forex chart pattern which forms when the price action is bounded by distinct support and resistance lines. Wedges can be both bullish and bearish patterns.


The wedge pattern is a forex chart pattern which forms when the price action is bounded by distinct support and resistance lines. Wedges can be both bullish and bearish patterns.
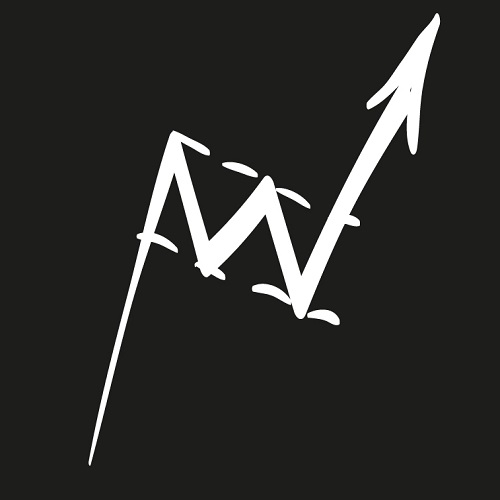
The flag pattern is a forex chart pattern which is formed where there is a pause in either an uptrending market or a down trending market.

Copy trading is quite simply the act of copying the trades of more experienced traders. MetaTrader offers a huge number of signals providers, some which may entail payment to the provider.

The Fibonacci Theory can yield forex trading profits from a forex strategy based on the commonality of numbers.
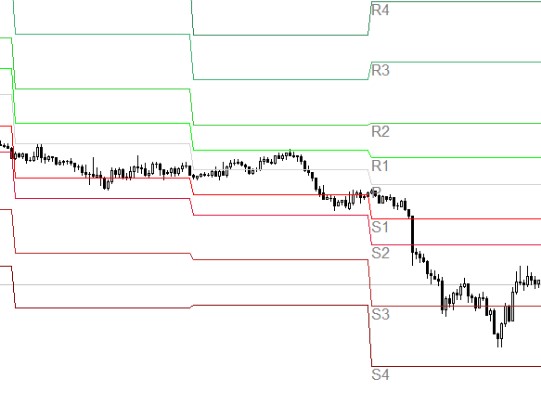
While all transactions resulting from a forex strategy have a pivot point based on market conditions, these targets are more important for short term action by punters, day traders, and swing traders.
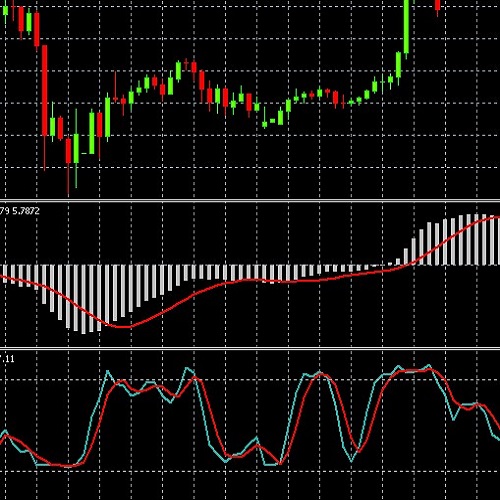
Read about how you can combine crossovers in the MACD and Stochastics indicators to obtain more accurate forex trading signals.

Read about how to compute the MACD indicator developed by Gerald Appel that is popular among technical analysts for generating trading signals.

Technical analysis is all about calculating future price action of a stock based on its past and, unlike fundamental analysis, not about the intrinsic value of the stock.