Liquidity in the forex market varies significantly among currency pairs and with the different trading sessions around the world. and we’re here to help you understand

Learn from the best professionals and be a part of the largest online community for creative people
Learn from the best professionals and be a part of the largest online community for creative people

Liquidity in the forex market varies significantly among currency pairs and with the different trading sessions around the world. and we’re here to help you understand
The Harami bullish and bearish candlestick patterns are one of the major candlestick pattern signals and are characterized by gapping bearish or bullish candle formations.
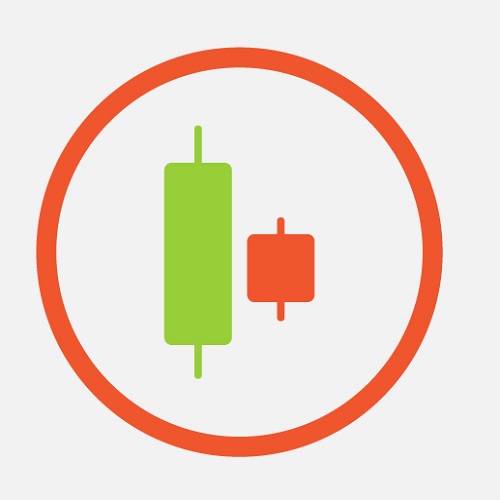
Candlestick chart patterns are an essential tool in a Traders armoury of technical analysis tools and should be used in conjunction with a second technical analysis tool for confirmation.

A bear market is best traded using a combination of short selling and purchasing put options to protect your portfolio.

To identify and follow stock trends successfully knowledge of technical analysis is important, especially understanding the meanings of candlestick chart patterns.

The terms “bull market” and “bear market” are used to describe market trends — one positive, the other negative.
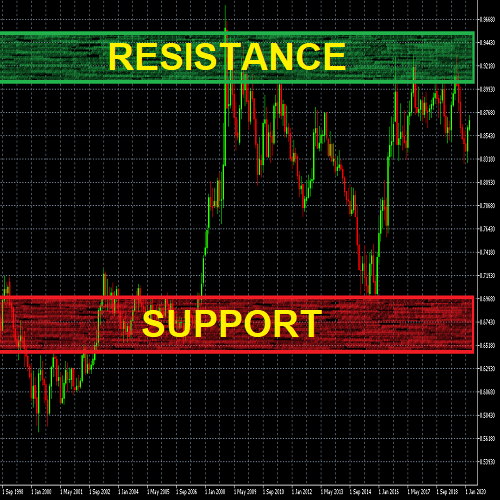
Forex support and resistance levels are price levels at which the trending movement of a currency’s price will not continue to move with the trend but will reverse its direction and bounce away from that price level.

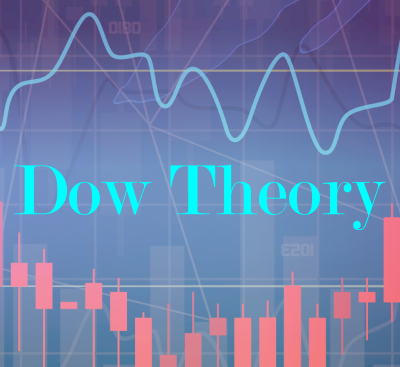
Learn about technical analysis and how chartists use various methods to forecast price movements in financial markets.