What is technical analysisA technique of forecasting the direction of prices by studying past market behaviour using primarily...?
Many investors use both fundamental and technical analysis to make trading decisions, but others prefer to stick with one that suits their trading styles and goals better.
Technical analysis is a method that seeks to analyse and predict the price movement of an assetA stock, commodity, currency, index or any other entity one may trade or invest in. by looking at its historical data such as previous price trends and volumeThe amount of total trades in an asset or market during a specified time period. It is sometimes als... using charts and other trading tools.
In contrast, and just as its name suggests, fundamental analysisThe study of an asset’s inherent value. Current affairs and economic data may influence the value ... examines securities based on their fundamentals, such as their revenues, valuations, economic events, or industry trends, among others.
Another thing that sets them apart is that fundamental analysis generally takes a long-term approach to trading while technical analysis is the exact opposite – it looks at short-term price fluctuations; hence it is often used by scalpers and day traders.
When using technical analysis, there are three helpful things to keep in mind when looking at charts and historical data of an asset:
- Everything is already on the price.
- Price moves in trends.
- Trends repeat over time.
Basic Technical Analysis Strategies
Depending on what kind of traderA merchant who purchases and sells assets or services for profit. In financial markets, the trader b... you are and what you hope to achieve, there are many strategies that you can take advantage of if you use technical analysis in your trades. Some of the most popular strategies are:
- Crossover Strategy- This is used to estimate the performance of an asset and to predict upcoming changes in trends such as reversals or breakouts, which can generate buy or sell signals. A crossover is a pointThe unit of price change for bonds (1%), futures (0.01%), shares ($1) and mortgage fees (1% of the p... where the asset’s price and technical indicator line intersect or when two indicators cross.
- News Trading Strategy- This involves trading based on news and marketA location or entity where people and entities can negotiate and trade assets of value. expectations right after a related public announcement and requires that the trader is aware how financial markets work.
- End-of-Day Strategy – This involves trading near the close of the markets, where end-of-day traders become active just as it becomes apparent that the price of an asset is going to close. This requires comparing the price movements to the previous day.
- ScalpingOpening and closing positions rapidly with the intention of locking in small profits. Trading Strategy – This involves placing very short-term trades with very small price movements. As a scalper, you want to capture a few pips profit from each trade in order to make incremental gains, which you can then assess at the end of the day, week, or month.
- Day TradingPratique de trading consistant à ouvrir et à fermer des positions le même jour et principalement ... Strategy –Also called intraday trading, this strategy is ideal for traders who actively trade during the day and involves taking advantage of price fluctuations between the opening and closing hours of the market. While the day trader may hold multiple positions open during the day, they do not leave this open overnight.
- Swing Trading Strategy – This involves taking advantage of the price swings in the market as it goes back and forth from an overbought to an oversold state. This is a technical approach to analysing the market by studying charts and examining individual movements that make up a bigger picture trend.
Things to Remember in Technical Analysis
As you will be looking at rising and falling trends of the price of an asset when using technical analysis, it is important that you are familiar with the common terms, charts, trendlines, price patterns, and what they mean.
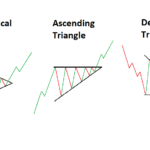
Price pattern is the noticeable movement of an asset’s price in the market that forms a pattern and is identified using a series of trendlines or curves. It can either be a:
- Reversal – This occurs when the price pattern signals a change in trend direction

- Continuation – This occurs when the price pattern continues its trend direction after a brief pause
Charts are graphical representations of the price of the asset over time and plots its historical data based on a combination of price, volume, and intervals. While there are several types of charts in technical analysis, the three (3) most commonly used chartA visual representation of (usually) numerical data. Financial charts can be either line charts, bar... types are the following:
- Candlestick – A candlestick chartA chart in which candle-like shapes display the opening and closing prices of an asset over a time p... shows the high, low, open, and closing (HLOC) prices for each period designated by the candle. The “body” of each candlestick represents the opening and closing prices, while the candle “wicks” displays the high and low prices for each period. Most candlestick charts use green and red as the default colours, with the green candles reflecting that the price closed higher than when it opened (aka bullish candle), while red means the price closed lower than when it opened (aka bearish candle).
- Bar – A bar chart, also known as HLOC chart, shows the high, low, open, and closing (HLOC) prices for each period designated by the bar. The vertical line is created by the high and low prices for the bar, while the dash to the left of the bar represents the opening price and the dash to the right signals the closing price.

- Line – A line chartIn finance, a 2-dimensional plotting of value over time. typically shows the closing prices and nothing else. Each closing price is represented by a single point and linked to the previous closing price to make a continuous line.
Trendlines are lines that connect two or more price points and extend into the future to act as a line of supportThe price level that traders believe represents the lowest value an asset can reach. At this point, ... and resistanceThe price level that traders believe represents the highest value an asset will reach before reversi....
- Uptrends happen when prices are making higher highs and higher lows. This trendline connects at least two of the lows and shows support levels below price. Support level indicates the price level that an asset would not fall below for period of time.

- Downtrends happen when prices are making lower highs and lower lows. This trendline connects at least two of the highs and indicates resistance levels above the price.
- Consolidation, or a sideways market, can be short-lived or long-lasting and happens when price swings between an upper and lower range, between two parallel and often horizontal trendlines.
While it is not required that you master both, many traders use both fundamental and technical analysis to make investmentAn asset (usually money or work) provided to another in expectation of receiving a cash return or be... decisions.
Learn more about technical analysis today with Queensway Academy. Sign up now for a FREE demo account.


