
Trading Using Pure Pricing Action
Pure price action trading strategies are a subset of technical analysis. The provide useful inidicators of excellent entry and points.
What are the most Popular Price Action Trading Strategies?
There are many types of sophisticated indicators that project future value evolution based on complex mathematical formulas and a series of numbers. However, the only ones that pure price action focuses on are those of recent buying and selling levels.
It therefore provides a basic, unvarnished strategy for those seeking to buy and sell foreign currencies for a profit – or any other market for that matter. As such, trading using pure pricing action can be applied to all market conditions with the benefit of not chasing lagging indicators.
What is Price Action?
Some trading strategies are based on trading signals provided by different technical indicators used together on a chart. But it is sometimes difficult to determine what one is really looking for when many indicators and trend lines are generated on a single chart.
Price action traders insist that multiple drawing tools and mathematical indicators in use are compensation for a lack of investment strategy, knowledge and certainty.
The concept of it is quite straightforward and easy to understand.
Instead of using fundamental factors from the news or lagging technical indicators to trade the markets, the trader should only use the price action of the underlying asset being trading to focus on actual price fluctuations.
Price action is used by many types of investors, especially short-term traders, like day traders, as they use available information accumulating in real-time and analyse its effects on price movements.
Given that the most important tool is the price itself, there are various disciplines available.
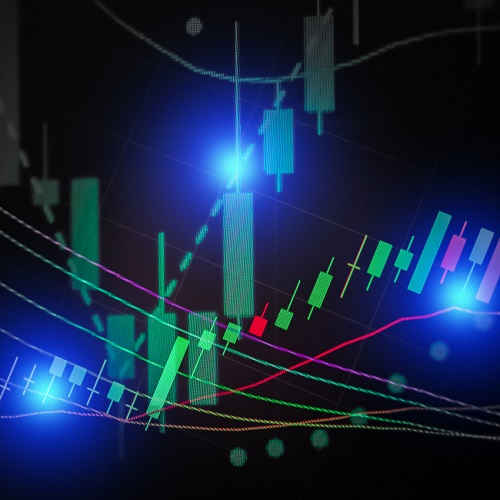
The essential pillars that make up price action are candlesticks, trends, and support and resistance levels.
Candlesticks, Trends, Supports and Resistances
Candlesticks are considerably versatile, here, as they display a lot more information than other types of charts. A candle is composed of high, low, open and close prices, which provide all the required information about market sentiment. There are also many candlestick formations that can display continuation and reversal patterns, as well as indecisive moments from market participants.
As one of the basics of technical analysis, trends are essential in understanding where the price of an asset is currently evolving and heading. There are three primary trends – Bullish, Bearish, and Flat.
A bullish trend depicts rising markets with higher highs and lows, while a bearish trend represents a bearish market forming lower highs and lows. The third kind of market trend is the ‘flat’ trend, also known as a ‘range’ or ‘lateral’ trend. In this case, neither the buyers nor sellers are in control of the markets.
Trend lines are the best tools to determine the trend of an asset. Support and resistance levels are also easily spotted, especially in flat trends. These levels are psychological areas that can impact price movement due to market psychology and memory.
Resistance is an area where sellers have taken control of the markets in the past after a rise. On the other hand, support is a zone where the buyers have taken over and pushed the markets higher after a fall.
Knowing these concepts, understanding how they relate to each other, being able to spot them on a chart, and utilising only the most appropriate technical analysis tools, are an excellent tool in developing a powerful strategy that not only delivers profits but also acts as an effective risk management tool.
 Pure Price Action is a Great Risk Management Tool
Scott Patterson, the author of “The Quants”, which detailed the fall of Wall Street’s asset managers who utilised sophisticated computer programs, stated that, “…risk management is about avoiding the mistake of betting so much you can lose it all…the mistake made by nearly every bank and hedge fund that ran into trouble in 2007 and 2008. It can be tricky in financial markets which can exhibit wild, Mandelbrotian swings at a moment’s notice.”
Pure price action works against this as it responds to immediate buying and selling. It is thus well-suited for day trading, scalping, and punters pursuing PIPs for profit.
From the risk management aspect, the only hedge fund that prospered during The Great Recession was the Renaissance Fund, as pointed out by Patterson in his book. This was because it focused on constant buying and selling so that it was able to profit from short term trading in the changing financial markets during that period.
Pure price action offers that same time protection in its basic form.
While it can be combined with any number of technical indicators, each of these will add another layer to the pure pricing action model, which will detract the price action trading strategy from the immediate buying and selling in the market.
Not only does it cloud the view of the market action, but it can also lead to misreading the trend of the underlying market being bought and sold. This, in turn, could lead to a constant pattern of small trading losses that would end up constituting a very large one at period’s end.
Conclusion
Although using price action is not a strategy that will result in huge profits, practising with risk management, such as avoiding margin debt so as to not be leveraged, can help prevail in all market conditions.
Used by itself, it can circumvent major trend reversals by focusing on incremental movements that yield small profits but avoid large losses. Over time, these profits will add up to success.