

Elliott Wave Theory – An In-Depth Analysis
What is the Elliott Wave theory and how does it work? Have a read through Queensway’s thorough guide to get to grips with this notion.
What is the Elliott Wave Theory?
The basic tenets of the Elliott Wave theory are that its code is ruled by the social behaviour of man. It expresses itself in the arrangement of forms, and as these forms are repetitive by nature, they have prognostic value.
Currency markets, in general, reflect the conditions and economic climate in the real world, but sometimes they reflect something else, which is unrelated to these conditions. Suddenly, the numbers seem to have a life of their own and the price trends are not the result of news or events, but the product of a repetition of forms that are represented by waves that form patterns of directional movements.
These patterns are used as a technical analysis tool, which can predict where the support and resistance price zones will fall in the future.
These Forex indicators, as we shall see below, repeat themselves over and over again, which allows for these patterns to be used as a tool to effectively increase your trading potential.
How Does it Work?
Elliott’s principle is based upon the basic laws that govern how investors behave collectively. This is commonly referred to as crowd psychology and can be seen throughout all different markets.
This model can be recorded and seen throughout the planet and is used by just about every species. Obviously, animals can be seen displaying a collective consciousness in the wild in order to gain an advantage; however, humans have managed to use this crowd mentality to decipher market growth-and-decline patterns.
This mere fact allows investors to make calculated decisions based on the Elliott wave pattern, which are determined by how humans act as a whole versus as individuals.
Over the years, psychologists have conducted numerous studies that have only cemented the theories of collective investor psychology or crowd psychology. It seems that even though there are hundreds, if not thousands of individuals operating independently, there always seems to be a trend that is dictated by a large group. For one reason or another, it seems that, even as the most evolved species on the planet, we still tend to believe that there is safety in numbers; only this time it is to gain a fortune rather than seeking protection from predators.
Getting to the Point…
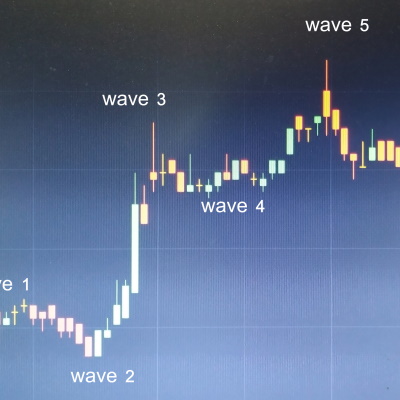
Ralph Nelson Elliott declared that the advancement of the currency market is represented by five waves in a particular structure.
Three of the five waves affect the directional trend and are separated by two waves which are counter to the general trend. These two counter-trend waves always occur within a larger directional movement.
Elliott observed that the five-wave sequence had an aspect to it that was always consistent. He observed that Wave 2 never progressed beyond the start of Wave 1; Wave 3 is never the shortest wave; Wave 4 never overlaps into the price range of Wave 1.
In fact, the 5 Elliott wave pattern is the one dominant sequence of waves in the markets. As can be seen from the diagram below, there are two styles of wave growth: motive or impulse, and corrective. The impulse waves are made up of five waves and the corrective waves are made up of three waves.

Waves 1, 3 and 5 are the impulse or motive waves because they are the main price trend followers.
The 2 and 4 waves are counter to the trend and are called corrective waves. This, however, is only part of the cycle, as one complete cycle is made up of eight waves.
The eight waves comprise the 5 wave impulse stage and a three-wave corrective stage.
In the diagram below, the five-wave motive stage is numbered 1, 2, 3, 4 and 5 and the three-wave corrective stage is numbered A, B and C. Note that the three corrective waves correct the five Elliott wave charts sequence.

The pattern, which is shown in the diagram above, repeats itself over and over again. Each five-wave pattern is, in fact, one degree greater than the composition of all its waves. This can be observed in the diagram below which shows several sequences of five-wave patterns.

Interestingly, the Elliott wave charts and diagram above is not only a bigger version of the previous diagram, but it also exemplifies it in much more detail.
If waves 1 and 2 above were to be scrutinised under a microscope, they would be of the identical form as waves 1 and 2, so, as we have said before, irrespective of grade, the form is always constant because it modifies wave A and is counter to wave 2.
The underlying tenet of Elliott wave analysis is kept so that the main price trend progresses in five waves, while the counter-trend develops in three waves. This tenet is more than amplified by the diagram below.

Here, we can see that in the market cycle, the waves will subdivide as shown above. The complete cycle is wave 1; the motive wave and Wave 2; the corrective or zigzag wave.
Within Wave 1, there are three sets of five waveforms and two sets of three waveforms. In Wave 2, there are two sets of five waveforms and one set of three waveforms. This shows how these waves can subdivide within the overall Elliott wave pattern.
Classification of Degrees
- Grand supercycle: covers a period over multiple centuries
- Supercycle: refers to a period between 40 – 70 years or a multi-decade
- Cycle: covers a period of several years or might even cover several decades in some cases
- Primary: refers to a period of between a couple of months to a couple of years
- Intermediate: a period of weeks to months
- Minor: refers to weeks
- Minute: spans days
- Minuette: covers hours of trend patterns
- Subminuette: covers minutes
The above-mentioned timeframes are used when implementing the Elliott Wave analysis or prediction method. The outcomes will obviously vary depending on the degree used, depending on the Elliott wave stock market you wish to trade in.
Investors will need to perform thorough research before implementing this type of strategy which is based purely on pattern recognition.
In conclusion, It is vital that practitioners keep in mind that this model is not fool-proof and in no way guarantees the trajectory of the market; nor does it guarantee a return. However, it does give the user a slight insight into the market and trends in terms of patterns of the past.