
Written By
In the journey to become a successful traderA merchant who purchases and sells assets or services for profit. In financial markets, the trader b... over a prolonged period, technical analysisA technique of forecasting the direction of prices by studying past market behaviour using primarily... tools can be a crucial ingredient in the recipe of any trading strategy.
One of the essential tools that traders can use are patterns, which enable them to spot trends and predict possible future outcomes.
Triangle patterns are a commonly-used tool, as they help traders recognize patterns as they form in the marketA location or entity where people and entities can negotiate and trade assets of value..
In the article below, we take a closer look at these patterns, including what they are and why they are important so that you can use them as part of a practical trading plan.
What Are Triangle Patterns?
A triangle is a continuation chartA visual representation of (usually) numerical data. Financial charts can be either line charts, bar... pattern that forms a triangle-like shape. The chart gets its name because the upper and lower trend lines meet at the apex on the right side, subsequently forming a corner.
Such patterns give traders a greater insight into future price movement and the possible continuation of the current trend.
It is important to note that not all triangle formations can be interpreted similarly. Consequently, it is necessary to understand each triangle pattern separately, on an individual basis.
There are three main types of patterns, each frequently appearing within the forex market due to their popularity among traders.
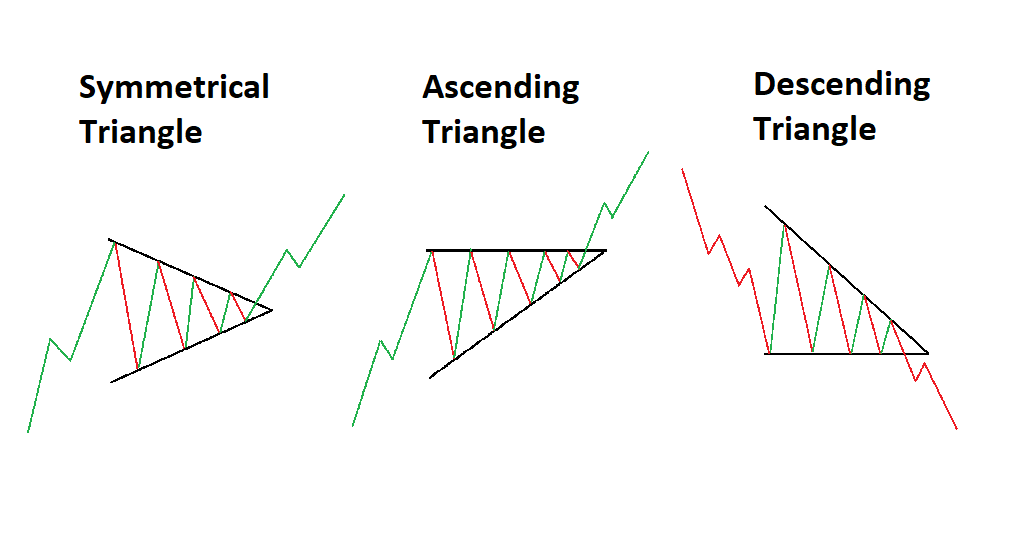
3 Key Triangle Patterns
- Symmetrical Triangle

Ascending triangle patterns consist of a bullish formation created when the price breaches the upper horizontal trend line with rising volumeThe amount of total trades in an asset or market during a specified time period. It is sometimes als....
It is considered a continuation pattern, meaning that the price will typically break out of the triangle in the price direction prevailing directly before the triangle.
Moreover, it is a tradable pattern in that it presents traders with a clear and demonstrable entry pointThe unit of price change for bonds (1%), futures (0.01%), shares ($1) and mortgage fees (1% of the p..., profit target, and stop-loss level.
- Ascending Triangle

Ascending triangle patterns consist of a bullish formation created when the price breaches the upper horizontal trend line with rising volume.
It is considered a continuation pattern, meaning that the price will typically break out of the triangle in the price direction prevailing directly before the triangle.
Moreover, it is a tradable pattern in that it presents traders with a clear and demonstrable entry point, profit target, and stop-loss level.
- Descending Triangle

A descending triangle is represented as an inverted version of the ascending triangle and is categorised as a breakdown pattern.
In this case, the lower trend line must be horizontal, connecting near-identical lows, while the upper trend line declines towards the apex diagonally.
It is a very popular chart pattern among traders as it can clearly show that demand for an assetA stock, commodity, currency, index or any other entity one may trade or invest in., derivativeA contract to trade an underlying asset (or a basket thereof) in the future. Examples of derivatives..., or commodityA tangible good that can be and which has been “commoditized”, i.e. standardized by quality and ... is weakening.
Why Should Traders Use Them?
There are several reasons why traders may want to use triangle patterns to their advantage, with the technical analysis tool having several beneficial elements.
First and foremost, compared to other analytical methods, this type of pattern structure is relatively easy to spot once an investor knows exactly what to look for.
Secondly, these patterns frequently appear in all market and financial instrumentA trade-able financial asset. These include currency pairs, documented proof of ownership or interes... types, including stocks, forex, cryptocurrencies, etc. This means that traders can easily incorporate triangles into their trading strategies, regardless of their portfolio.
Another significant advantage of using triangle patterns indicates that a breakout is imminent. Consequently, investors can then predict the breakout direction, with the possible result being large profits with minimal riskThe level of deviation of past returns and/or losses on an asset from the mean. Usually, the higher ....
Dealing With False Breakouts
One of the main problems that traders are faced with when trading triangles, or any type of chart pattern, is a false breakout.
A false breakout is when the price moves outside the triangle, signalling a breakout before reversing its course and potentially even performing a breakout on the other side of the triangle.
The major downside of this situation is the trading loss experienced by those affected. However, traders should keep in mind that not all breakouts will be false.
Indeed, on some occasions, false breakouts can work to their advantage, as they can help traders take trades based on the anticipation strategy.
For example, if a trader is not actively in a trade but sees that the price has made a false breakout opposite to what is expected, they could consider jumping into the trade.
Final Thoughts
Gaining a proper understanding of how to interpret and trade triangles is a valuable tool to have in the armoury of any successful trader, should these patterns occur.
While they are familiar and appear frequently, they will not be relevant to every investmentAn asset (usually money or work) provided to another in expectation of receiving a cash return or be... type.
These patterns form a part of a broader collection of strategies that traders can use to their benefit.