
Using Fibonacci Numbers to Evaluate Stock
Fibonacci numbers are used by stock traders to evaluate support and resistance price levels. Read on to find out more with Queensway.
What are Fibonacci Numbers?
The history of the Fibonacci numbers or sequence is shrouded in a cloud of mystery. Most researchers believe they were first used in Indian Mathematics; however, they are named after Italian mathematician, Leonardo Bonacci who later became known as Fibonacci.
The Fibonacci sequence adheres to the Golden Ratio and seems to exist almost everywhere in nature. It has been used for centuries to make accurate calculations or predictions in a variety of fields
How They Are Used When Evaluating Stocks
Many investors use Fibonacci numbers to identify the retracements of stock prices during an upward or downward trend.
Fibonacci retracements are a charting tool which is based on the number series which Fibonacci developed. The numbers series is: 1, 2, 3, 5, 8, 13, 21, 34, 55, 89 and so on.
The series is constructed by adding the two consecutive numbers to get the third number; so 8+13=21 and 13+21=34. The really interesting aspect of these numbers is the relationship between them.
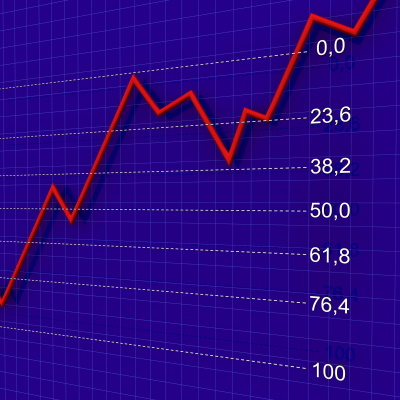
For example, the relationship between two consecutive numbers in the Fibonacci series is either 50% or 61.8% or 38.2%, and these represent the amount that asset prices retrace from the previous price movement trend.
To evaluate the asset that you hold, you should first make use of a candlestick chart so that you can start to evaluate the stock’s movement. If you see that the stock is retracing during a downtrend at the 32.8% level, then it might be the right time to consider buying the asset. If it is retracing during an uptrend, the trader should decide whether to hold or to sell.
The Costco one day candlestick chart below shows the stock is in an uptrend but has retraced through the 61.8%, 50% and 38.2% retracements before the price starts to move upwards once more.
 The downturn should be evaluated as it moves down. The Fibonacci retracement levels are essentially support levels when a stock is moving down or resistance levels when a stock is moving upwards.
Wait for the stock to bounce off the levels and if it doesn’t bounce off the first level, or hold on to that level, then it will more than likely move to the next level. Once you see the bounce, then it’s time to buy (the resumption of a bullish trend) or sell (resumption of a bearish trend).
Traders believe that if Fibonacci trading tools are applied correctly, they can predict the behaviour of the markets 70% of the time on average.
However, accomplished traders don’t rely on the Fibonacci tools exclusively. They always confirm the support and resistance levels using another technical analysis indicator.
Sometimes however, the predicted support and resistance levels become psychological levels and traders use Fibonacci as a tool to influence the way they trade, but not as a predictive tool at all.
So, Fibonacci retracements and other Fibonacci tools are not a golden solution for finding entry and exit points, but rather a picture of ‘comfort’ for traders as to the probable direction of the stock.
Implementing the Different Types of Fibonacci Trading Techniques
Fibonacci Retracements
This is the tool of choice used to predict or technically analyse areas of resistance or support. These levels are portrayed by horizontal lines which show possible areas and where they may be. It is based on percentages and depicts how far the price will move based on prior retracements.
Fibonacci retracement traders can expect to notice retracement levels along the following percentages – 23.6%, 38.2%, 61.8% and 78.6%.
The reason for this method being so widely used and abided by is due to the fact that it can be used between any two important price points. Once the indicator is drawn, these points will remain fixed; however, the percentage levels that are provided will indicate what may happen.
Do not rely solely on this technique, as it is in no way a guarantee as to what the market will do; rather use it in tandem with other techniques to create a more stable picture for you to trade with.
Fibonacci Fans
 A Fibonacci fan refers to a technique that is used by traders who use the Fibonacci ratios to estimate resistance and support levels on a chart.
The chart will show the low and high prices over a certain time period as the trend lines which are drawn are usually generated from trough to peak, which is set by Fibonacci retracements.
The trader divides the prices at the low and high times. Traders will likely use the following percentages – 23.6%, 38.2% 50% and 61.8%.
Fibonacci Extensions
Traders will make use of the Fibonacci trading extensions when trying to estimate the extent to which a price may drop once the pullback or retracement has come to an end or in order to establish a profit target in their desired market.
This is also a vital tool in determining likely areas where the prices may see a reverse trend.
As with the previous techniques, traders will make use of a chart that the extensions are drawn on which will indicate levels of possible importance. Traders are likely to see extensions levels such as 61.8%, 100%, 161.8% and 200%.
Keep in mind that using this technique exclusively does not always yield favourable results. It should always be used in conjunction with a variety of other methods in order to truly predict outcomes with precision.
So, extensions indicate where prices are most likely to go after a retracement, whilst Fibonacci retracements indicate impulse waves in terms of the direction of a trend – both excellent uses of the Fibonacci numbers sequence.