
Moving Averages: Understanding the Basics
Among the most popular indicators for technical analysts, moving averages are one of the most widely used. Learn how to use moving averages with Queensway.
Moving the Averages
Moving Averages, also known as MA, are one of the easiest and most widely used trading tools, especially by technical analysts. Even for equities traders, it is quite easy to find a stock’s moving average.
To put it simply, this indicator “smooths” a series of prices over a period of time by eliminating the least significant price fluctuations. This then provides an average price that will not include market noise.
With this, traders can easily determine the underlying trend of an asset reflecting in the investors’ sentiment. There are three types: Simple, Weighted and Exponential.
Below, we reveal the main differences between each and explain how to use them.
Simple Moving Average (SMA)
The SMA is the simplest one of the three.
It is a line created by computing the average of n closing periods before each successive location along that line.
To compute it, you first need to sum up the prices over a selected time period. Then, you need to divide the sum by the total number of periods.
For instance, to find out the 20-Day SMA, you need to add the prices (ideally the closing prices) from the last 20 days and divide the result by 20. The next place along the line is the average of the previous 20 places beginning one up from the previous computation. And so forth.
L(n)=l(n-1)+l(n-2)l(n-3)+…. +l(n-n)
n
L(n+1)=l(n)+l(n-1)+…. +l(n-(n-1)) ….
n
While the MA represents a lagging indicator, the SMA has the disadvantage of lagging price action more so than the weighted or exponential ones.
Weighted and Exponential
The weighted (WMA) and exponential (EMA) moving averages generally give more weight to recent data, reduce the lag, and allow the trader to be more responsive to market conditions.
However, as they follow the price changes more closely, they are vulnerable to unusual bullish or bearish price movements. This is why some traders prefer to use the SMA over the EMA and the WMA.
How to Use Moving Averages in Your Trading
When applied in the technical analysis of charts, the most useful aspect of this indicator is the smoothing effect it has on prices. This can be especially useful for a trader who wants to clarify the direction of an underlying asset trend.
By filtering the noise of the market, the MA is considered a trend-following indicator that helps determine support and resistance levels. Usually, when prices trade above the MA, there is a bullish trend. Conversely, there is a bearish trend if prices are below the MA.
The MA can also be used as a money management tool to place stop-loss and take-profit orders.
Do not forget that controlling your risk is essential for your success. Therefore, it is often advised to use automatic orders that will close your winning and losing positions when they reach pre-determined levels. By acting as support and resistance levels, an MA can be helpful when placing these orders.
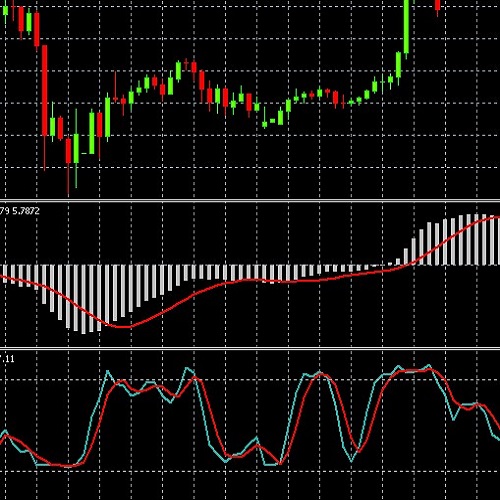
MAs are also at the core of a technical indicator called the MACD (Moving Average Convergence Divergence). This compares two EMA to provide indications about the state of an asset’s momentum.
To get the MACD indicator, you need to subtract the long-term EMA (usually 26 periods) from the short-term EMA (usually 12 periods). This is called the MACD line. Trading signals are triggered when the MACD line crosses the Signal line, which is a 9-periods EMA of the MACD line.
Generating Trading Signals with Crossovers
The first example of a trading signal is the one mentioned above – when prices cross above (potential buying signal) or below (potential short-selling signal) the MA.

Another extremely useful technique is when traders rely on more than one moving average on their charts, as crossovers provide buying or selling trading signals.
For example, a trader could look for a crossover of a shorter-term MA moving above a longer-term one, which would typically generate a buy signal. Conversely, a trader might interpret a crossover of a shorter-term MA moving below a longer-term one as a sell signal.
Among the most popular MA crossovers, traders use 20 and 50 periods, 100 and 200 periods, as well as 50 and 200 periods. A figure called ‘the golden cross’ occurs when the MA 50 crosses the MA 200. The opposite is called ‘a death cross’. These events are important for technical analysts and are often used to either enter or exit the market.
How to Choose the Perfect One for your Trading
If you’re wondering what the best moving average is to use without knowing your ultimate goal, you’re going about it the wrong way.
Instead, think about the following – what do you want to achieve with the MA? Fundamentally, it all depends on your trading style and investment strategy.
While a fast MA can provide many signals (including false ones) and incorporate market noise, slow-moving MA will tend to react to changes slower, but help you take advantage of longer trends.
Long term traders often compare the prevailing price of an asset to its 100-Day or 200-Day MA when determining the overall direction of the underlying trend. Intermediate and short-term traders will use periods like 20 or 50.
Of course, using an MA on 200 days will present a greater lag compared to an MA on 20 days, as they include more periods. For this reason, MAs on longer periods are usually used to determine the overall trend, while MAs on shorter periods are used to spot support and resistance levels and reversal points.
A final note – using the correct moving averages method for your trading style will help you develop a profitable approach in the market. One of the greatest advantages of this indicator is that you can choose between its three different kinds and create a customised version that perfectly fits your strategy.